Prediction of thistle infested areas in Badlands National Park
using a GIS model
Maribeth Price and Jason Tinant
South Dakota School of Mines and Technology
Rapid City, SD 57701
August 14, 2000
Abstract
Canada thistle (Cirsium arvense) is a highly invasive, noxious weed that is widespread
throughout the Badlands National Park. This study sought to identify significant
correlations between known thistle occurrences and environmental parameters including
soils, geology, vegetation communities, slope, aspect, distance to water, distance to
roads, and satellite-derived vegetation and moisture indices. Two approaches were tried, a
logistic multiple linear regression, and a statistical frequency analysis. Three maps were
produced, including a probability map based on the regression, a Z-score map based on the
frequency analysis, and a combination map including both approaches. Significant factors
correlating with thistle occurrence include soils, geology, vegetation communities, slope,
and NDVI. The accuracy of the maps was assessed against known thistle infestations in the
park. The maps show areas where thistles are likely to become established and spread, but
do not well predict where thistles may be found at any given time.
Introduction
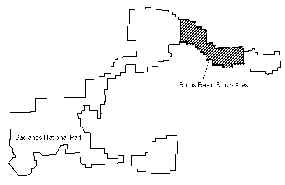
The Badlands National Park (BADL) has contracted with Dr. Maribeth Price and the South
Dakota School of Mines and Technology to analyze spatial correlation between Canada
thistle and environmental parameters within the Burns Basin area of the National Park
(figure 1).
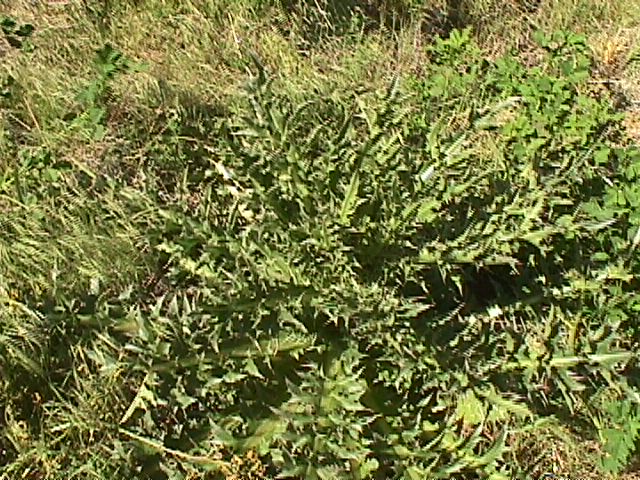 Canada thistle (Cirsium
arvense) is a highly invasive, noxious weed that is widespread throughout the Badlands
National Park. The potential problems with the widespread occurrence of this pest are the
displacement of native plants, potential harboring of predators in black-footed ferret
reintroduction sites and causing economic damage to adjacent agricultural lands. The
Canada thistle population exceeds the park’s current chemical, mechanical and
biological control programs. Thus, an intensive herbicide treatment program has been
proposed.
Canada thistle (Cirsium
arvense) is a highly invasive, noxious weed that is widespread throughout the Badlands
National Park. The potential problems with the widespread occurrence of this pest are the
displacement of native plants, potential harboring of predators in black-footed ferret
reintroduction sites and causing economic damage to adjacent agricultural lands. The
Canada thistle population exceeds the park’s current chemical, mechanical and
biological control programs. Thus, an intensive herbicide treatment program has been
proposed.
Figure 2. Canada thistle
 Tordon, a picloramine compound manufactured by Dow Chemical has been shown
to be effective in thistle control. However, the physical properties of Tordon have been a
cause of concern for the Badlands National Park. Tordon is a broad-based herbicide,
killing native species of plant life as well as Canada thistle. Tordon has a long
residence time in soils, leading to potential ground-water contamination. Spatial analysis
of the treatment site will better locate areas of infestation, thereby minimizing the
amount of pesticide used.
Tordon, a picloramine compound manufactured by Dow Chemical has been shown
to be effective in thistle control. However, the physical properties of Tordon have been a
cause of concern for the Badlands National Park. Tordon is a broad-based herbicide,
killing native species of plant life as well as Canada thistle. Tordon has a long
residence time in soils, leading to potential ground-water contamination. Spatial analysis
of the treatment site will better locate areas of infestation, thereby minimizing the
amount of pesticide used.

Justification of Research
The rugged nature of the Burns Basin area of the Badlands National Park makes field
identification of thistle-infested areas both cost and time prohibitive. A map showing
areas where thistles are likely to grow or spread can reduce the time and effort required
to search for and locate infestations. In addition, a predictive thistle model will aid in
guiding management decisions in the application of Tordon.
Approach
The study sought to identify significant correlations between known thistle occurrence and
environmental parameters including soils, geology, vegetation communities, slope, aspect,
distance to water, distance to roads, and satellite-derived vegetation and moisture
indices. A horseback survey of the Burns Basin (Figure 2) in 1998 provided a map of known
thistle locations. The environmental parameters comprised a series of GIS layers obtained
from BADL and other sources. Two distinct approaches were applied to develop a GIS model
of thistle-infestation probability. Numeric parameters, including the slope, distance, and
satellite indices were amenable to analysis by logistic multiple linear regression. The
thematic variables, including soil, geology, vegetation community, and aspect, are not
suitable for regression analysis, so a statistical approach was applied in assessing the
frequency of thistle infestation in particular classes. The final product is a map showing
the probability of thistle infestation for the Burns Basin. Three maps are presented, one
based on the regression alone, one based on the frequency analysis alone, and one
combining the two approaches.
Analysis of thistle locations using multiple linear regression
A logistic multiple linear regression was applied to the following GIS data layers: slope,
distance to streams, distance to water bodies, distance to wetlands, distance to roads,
Normalized Difference Vegetation Index (NDVI), and Normalized Difference Moisture Index
(NDMI). Slope was calculated from the standard USGS 30m Digital Elevation Model (DEM)
products obtained from BADL. The distance to roads, streams, water bodies, and wetlands
was calculated from the GIS layers of these features obtained from BADL and based on the
USGS 1:24,000 Digital Line Graph products. The spring and fall NDVI and NDMI values were
derived from a May 03, 1998 and November 17, 1998 Landsat TM image. NDVI is an index of
greenness that correlates roughly with biomass and is calculated as NDVI = (B4-B3)/
(B4+B3), where B3 and B4 are Bands 3 and 4 of a Landsat TM image, corresponding to
measured red and near-infrared reflectance. NDMI is an analogous index sensitive to soil
moisture and is calculated NDMI = (B4-B5)/ (B4+B5).
In order to perform a logistic regression, it was necessary that the locations of some
thistles as well as an approximately equal number of thistle-free locations be known. The
known thistle locations were derived from a horseback GPS survey conducted in 1998
by BADL within the Burns Basin Wilderness
area. The survey tallied a total of 120 point locations representing thistle infestations
0-5 acres in size, and mapped approximately 40 polygons of intensive thistle growth with a
total area of 1.4 x 10⁶ m2. To produce point locations free of thistles, we generated approximately 160
randomly distributed locations within the study area, excluding those that occurred within
the mapped thistle polygons, or within 90 meters of a mapped thistle point. (A five-acre
circle corresponds to a circle 80 m in diameter.) However, one must be aware that there is
a chance that a thistle-free location actually contains thistles that were not mapped by
the BADL survey. The random non-thistle and known thistle locations were then combined to
produce a single data set for the logistic regression.
Logistic regression established the relationships between the environmental parameters
and the sample data. This relationship is reported as a coefficient between negative one
and one, with higher magnitude number showing a greater relationship between thistle
occurrence. A
positive value
close to one indicates a strong positive correlation, and a negative value close to
–1 indicates a strong negative correlation. The output coefficients of each
environmental parameter were then used to calculate the probability of thistle occurrence
in an area based on the environmental parameters present.
The regression indicated that slope, NDVI, and NDMI were the best predictors of thistle
growth; however the individual correlation coefficients were all less than 0.2, and the
overall correlation coefficient was about 0.4 (Table 1). The probability map showing the
probability of thistle occurrence based on the logistic regression is shown in Figure 3.
Table 1.
Results of Logistic Regression |
Layer no. |
Coefficient |
Environmental
parameter |
0 |
39.392 |
|
1 |
-0.002 |
Distance to
water bodies |
2 |
-0.005 |
Distance to
streams |
3 |
-0.009 |
Distance to
wetlands |
4 |
0.007 |
Distance to
roads |
5 |
0.015 |
Topographic
slope |
6 |
-0.035 |
Fall 1998 NDVI |
7 |
-0.222 |
Spring 1998 NDVI |
8 |
0.11 |
Fall 1998 NDMI |
9 |
0.019 |
Spring 1998 NDMI |
|
|
|
|
RMS Error: |
0.296 |
|
Chi-Square: |
-2.283 |
The logistic regression of the sample data showed fair to poor correlation with the
parameters chosen. The strongest predictor of thistles in Badlands National Park was the
spring NDVI image with a correlation coefficient of –0.22, followed by the fall NDMI
image with a coefficient of 0.19. The other layers had coefficients less than 0.1.
Analysis of discrete variables (geology, soil type, aspect, and vegetation community)
Because logistic regression can only be performed on numeric variables (such as slope),
analysis of the discrete variables geology, soil type, aspect, and vegetation types was
performed using a probability prediction model. In this model, one assumes that if
thistles were randomly located, the number of thistles found in each cover type would be
proportional to the area fraction of the cover type in the study unit. One can thus
compare the expected number of thistle locations to the observed number to determine cover
types for which thistles seem to show an affinity or aversion. A Z-score representing the
statistical significance of the apparent affinities or aversions may be calculated.
Polygon coverages of each of the variables were provided by BADL. Each coverage was
clipped to the study area boundary. Area fractions qi of each occurring class
(e.g. geologic unit) were computed for the study area. The number of thistle points Ni
falling within each class was determined, with the total observed points N =
SNi. The predicted number of thistle points for each class Ei was also
determined as the mean of the binomial distribution function Ei = Nqi,
and a 2s confidence interval about this mean was calculated using the formula for the
standard deviation of the binomial distribution function s = [Nqi(1-qi)]0.5.
Classes for which the observed thistle locations fell outside the 2s confidence interval
of the predicted locations were considered to have a significant correlation (positive or
negative) with thistle growth.
For each cover type a Z-score was calculated using Z = (Ni – Ei)
/ [Nqi(1-qi)]0.5 to show the number of standard
deviations that the observed value falls from the expected value. A positive Z-score
greater than 2 indicates a less than 5% probability that this number of points occurred in
that particular cover type by chance. A negative Z-score less than –2 indicates that
far fewer thistle points were observed in that unit than would be expected by chance. Thus
a negative Z-score less than 2 suggests that thistles show an aversion to the cover type,
and positive Z-score greater than 2 suggests that thistles show an affinity for that cover
type.
Highly significant positive and negative correlations were found with geology, soil,
and vegetation class. Aspect was not found to be a significant indicator of thistle
location. Table 2 shows all of the cover types for which a significant Z score (< -2 or
> +2) was found.
Table 2. Significant correlations of thistle locations to map units.
|
AREA |
OBSERVED |
Q |
EXPECTED |
95% CONF |
Z_SCORE |
GEOL_UNIT |
|
|
|
|
|
|
| Qa |
4864113 |
14 |
0.0410 |
7.0 |
2.6 |
2.69 |
| Qe |
6615466 |
0 |
0.0557 |
9.6 |
3.0 |
-3.20 |
| Qoa |
67973775 |
150 |
0.5725 |
98.5 |
6.5 |
7.92 |
| Tb |
21437980 |
5 |
0.1806 |
31.1 |
5.0 |
-5.22 |
| Tc |
12417326 |
3 |
0.1046 |
18.0 |
4.0 |
-3.75 |
|
|
|
|
|
|
|
| SOILS |
|
|
|
|
|
|
| Bb |
39957017 |
7 |
0.3366 |
57.9 |
6.2 |
-8.21 |
| BoB |
6847667 |
0 |
0.0577 |
9.9 |
3.1 |
-3.19 |
| CeA |
4357595 |
27 |
0.0367 |
6.3 |
2.5 |
8.28 |
| CfA |
7632849 |
69 |
0.0643 |
11.1 |
3.2 |
18.09 |
| Ch |
12993130 |
37 |
0.1094 |
18.8 |
4.1 |
4.44 |
| DmA |
1662230 |
7 |
0.0140 |
2.4 |
1.5 |
3.07 |
| FaE |
3263503 |
0 |
0.0275 |
4.7 |
2.1 |
-2.24 |
| KtA |
2621654 |
0 |
0.0221 |
3.8 |
1.9 |
-2.00 |
| WwB |
3279606 |
0 |
0.0276 |
4.8 |
2.1 |
-2.29 |
|
| VEG_CODE |
|
|
|
|
|
|
2 |
47901311 |
14 |
0.40621 |
69.1 |
6.4 |
-8.61 |
16 |
53766660 |
142 |
0.45595 |
77.5 |
6.5 |
9.92 |
17 |
3600252 |
0 |
0.03053 |
5.2 |
2.2 |
-2.36 |
|
Vegetation Codes |
|
|
|
2 |
Badlands Sparse
Vegetation Complex |
|
|
16 |
Western Wheatgrass
Grassland Alliance |
17 |
Introduced
Grassland |
Geologic
Units |
|
Qa |
Quaternary Alluvium |
Qe |
Quaternary Eolian
Sand |
Qoa |
Quaternary Older
Alluvium; terraces |
Tb |
TertiaryBrule
Formation; clay, silt, sand, volcanic ash |
Tc |
Tertiary Chadron
Formation; sand, clay |
Soils |
|
Bb |
Badland |
Bob |
Blackpipe Wortman
complex |
CeA |
Cedarpass silty
clay loam |
CfA |
Cedarpass-Denby
complex |
Ch |
Cedarpass-Interior-Badland
complex |
DmA |
Denby silty clay |
FaE |
Fairburn clay loam |
KtA |
Kyle clay |
WwB |
Wortman silt loam |
Maps showing the Z-scores for each cover type group (geology, soils, and vegetation
class) were developed and provide a spatial view of the areas of high and low probability
of thistle occurrence. Figures 4-6 show the Z-score maps, with the negative Z-scores
(thistle aversion) shown in shades of blue, neutral areas shown in white, and positive
Z-scores (thistle affinity) shown in shades of orange. More saturated colors indicate a
higher affinity or aversion potential of that cover type.
The three individual maps were added together to produce a summed Z-score map, showing
the combined Z-scores over the map area (Figure 7). This map serves as a probability map
showing the areas of greatest potential thistle affinity and aversion. The maps use the
same color scheme as the previous figures.
Combined Z-score and Regression map
We integrated the information in the summed Z-score and regression maps in order to
include both types of information in a combined infestation affinity map. To do this, the
probability of thistle infestation in the regression map was multiplied by 10 to produce
scores between 0 and 10, and the result was added to the summed Z-score map. The number 10
was chosen to equalize the weights applied to each of the four input maps (soil Z-scores,
geology Z-scores, vegetation Z-scores, and the regression). The combined map is shown in
Figure 8.
Accuracy Assessment
In order to assess the accuracy of the probability map, thistle data was collected along
four transects in the park. The transects were chosen to cross a range of Z-scores on the
map, cross navigable terrain as much as possible, and start and end near roads (Figure 3
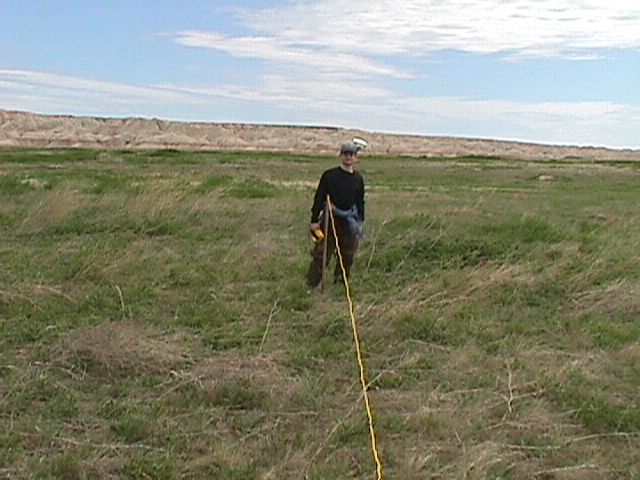
shows the transects best). Approximately every 150 meters along each transect, all the
thistles were counted or estimated within a circle 20 m in diameter. The circle was
defined using a rope 10 m long, attached to a stake. The
person at the center of the circle counted thistles between the center and a knot at 5
meters on the rope, while the other person walked around the circle holding the rope and
counted thistles between the end of the rope and the knot. In thick infestations, thistles
were estimated by watching the rope crossing the thistles and estimating every time groups
of 10 or 20 or 50 thistles were crossed, depending on the thistle density.
In the accuracy assessment, values were determined for the regression probability map,
the Z-scores map, and the combined Z-score/regression map for each point in the transects,
as well as for each point in the original BADL thistle survey. Each transect point was
classified as thistle or no-thistle. All of the BADL survey points were considered thistle
points. The distribution of thistle points and non-thistle points falling within three
probability ranges were then compared. Because the BADL points were used in the original
regression and probability model, those values were tallied separately from the transect
values.
Figure 9. Field assistant Marius Vulcan counts thistles from the center of a 10-m
radius circle.
Table 3. Accuracy assessment of the maps.
| Regression map |
0-33% |
34-67% |
68-100% |
Min |
Max |
Avg |
| No thistle -transect |
69 |
5 |
62 |
0.00 |
1.00 |
0.42 |
| Thistle-transect |
7 |
1 |
21 |
0.00 |
1.00 |
0.72 |
| Thistle-BNP map |
46 |
26 |
98 |
0.00 |
1.00 |
0.64 |
|
|
|
|
|
|
|
| Z-value map |
<-4 |
-4 to 4 |
>4 |
Min |
Max |
Avg |
| No thistle-transect |
32 |
11 |
88 |
-20.6 |
35.9 |
9.1 |
| Thistle-transect |
1 |
4 |
24 |
-8.9 |
35.9 |
15.3 |
| Thistle-BADL map |
6 |
8 |
156 |
-22.0 |
35.9 |
24.1 |
|
|
|
|
|
|
|
| Combined map |
<-4 |
-4 to 4 |
>4 |
Min |
Max |
Avg |
| No thistle-transect |
27 |
9 |
95 |
-20.6 |
43.9 |
12.9 |
| Thistle-transect |
0 |
1 |
28 |
-8.9 |
42.9 |
21.8 |
| Thistle-BADL map |
5 |
2 |
163 |
-15.0 |
44.9 |
30.0 |
The results shown in Table 3 suggest that the maps predict areas where thistle
infestations are possible based on affinities for certain land characteristics, but do not
well predict where actual infestations are currently found.
For example, of 176 points classified as no-thistle
points on the transect, 69 fell in areas that the probability map indicated had low
probability of thistle occurrence, 5 occurred in moderate- probability areas, and 62
occurred in areas ranked as high probability. Thus, many areas ranked as high probability
do not have thistles growing on them. However, on the Z-value map, out of 29 transect
locations having thistles, 24 of them occur in high-probability areas. For the BADL
locations, 156 out of 170 thistle locations occur in high probability areas. Thus the
areas where thistles are known to occur are found almost exclusively in high probability
areas. Thus these maps should be called thistle-affinity maps rather than
thistle-probability maps, and might be used to indicate the areas where thistles are
likely to establish and spread, rather than where they are actually located at any given
time.
The regression map does a poor job of predicting thistle affinity, which is not
surprising, given the low correlation coefficients from the regression. However, the
combined Z-value/regression map has the highest accuracy of all the maps. Despite the low
correlation coefficients, the regression map nevertheless adds some additional
information.
Discussion and Conclusions
Maps of thistle affinities were developed for the Burns Basin area of Badlands National
Park based on soils, geology, vegetation communities, slope, roads, water sources, and
Landsat TM satellite index parameters NDVI and NDMI. The maps show areas where thistles
are most likely to become established and spread, but do not predict where thistles will
be found at any given time.
During field work in the study area north of the Badlands Loop road , we noted a strong
association between water bodies and the presence of thistles, and the failure of this
association to show up in the regression model was surprising. Possible reasons for this
include: 1) The BADL thistle survey did not extend north of the Loop road; 2) The water
bodies shown on the hydrology layer did not well correlate to actual water bodies due to
variations in body sizes depending on season or rainfall; or 3) Other factors besides
water needed to be present to support thistles. Future work might test z-scores of a
buffer zone around the water bodies to see if this association in fact holds in the Park.
Another anecdotal association has been noted between prairie dog towns and thistles, which
could be tested when the GIS layer for prairie dog towns is complete.
The Z-factor and regression models in this study could be applied to estimate thistle
affinities in the entire park based on the correlations discovered in Burns Basin. This
map could assist BADL personnel in estimating the total acreage in the park that is
susceptible to thistle infestation, and in analyzing the distribution of high-affinity
areas within the hydrologic drainage basins to help assess the hazards associated with the
spraying of Tordon.
Back to "Trips
and Collaboration" SD Personnel and NASA Centers / NASA-related activities website